Allocation to Alternative Investments
For many years, alternative investments have been limited to certain investors, but access to these types of solutions is growing. Exposure to alternative investments among wealth management clients is expected to grow by 50% in North America in the next few years. 1
Institutional vs. Individual alternatives exposure
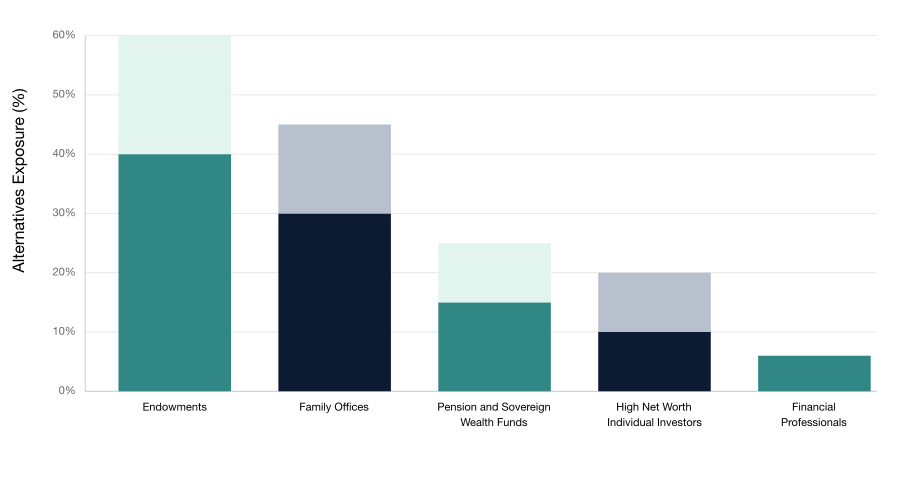
Sources: Endowments, Family Offices, Pension and Sovereign Wealth Funds data from UBS Alternative Investments, December 2020 and UBS Global Family Office Report 2021. High Net Worth Individual Investors data from Statista. Financial Professionals data from FundFire. Source: Statista, 2021. Based on a survey of 2,500 wealth management respondents.
1 The information presented is not intended to constitute an investment recommendation for, or advice to, any specific person. By providing this information, Intelligence Driven Advisers is not undertaking to give advice in any fiduciary capacity within the meaning of ERISA, the Internal Revenue Code or any other regulatory framework. Financial professionals are responsible for evaluating investment risks independently and for exercising independent judgment in determining whether investments are appropriate for their clients.
15-Year Annualized Risk and Return by Asset Class
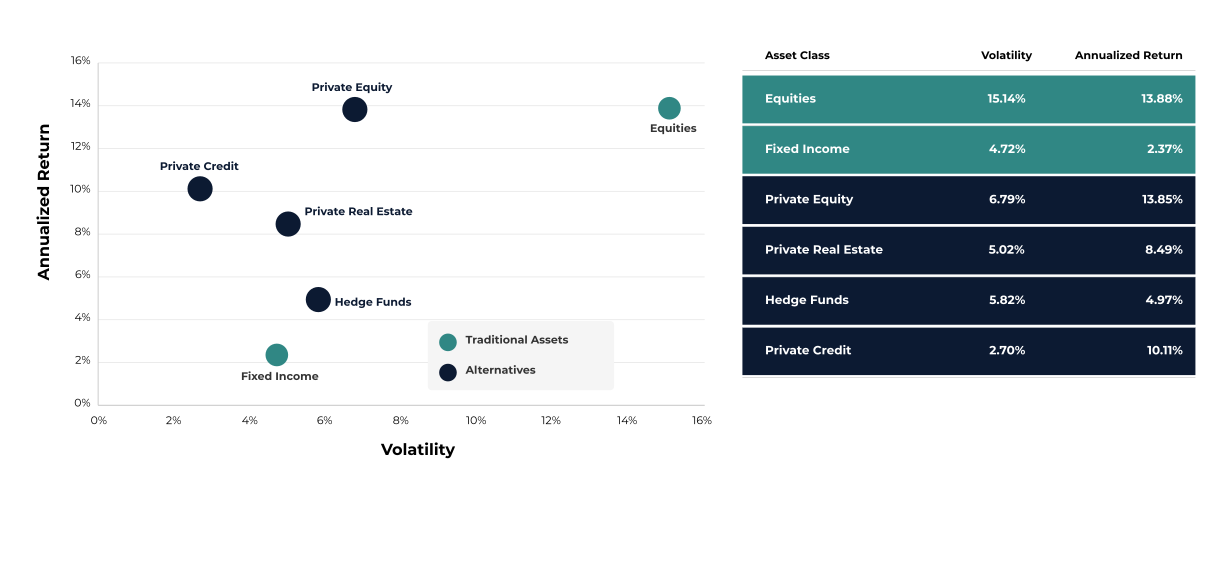
Source: Cliffwater, Evestment, Preqin. Based on quarterly returns from 3/31/2010-12/31/2024, most recent data available. Equities: S&P 500 Index, Fixed Income: Bloomberg U.S. Aggregate Bond Index, Private Real Estate: NCREIF Open-End Diversified Core Equity Fund Index (NFI-ODCE), Hedge Funds: HFN Aggregate Hedge Fund Index, Private Equity: Preqin Private Capital Quarterly Index, Private Credit: Cliffwater Direct Lending Index. The S&P 500 Index is an unmanaged index of 500 companies used to measure large-cap U.S. stock market performance. The Bloomberg U.S. Aggregate Bond Index represents securities that are SEC-registered, taxable, and dollar denominated. The index covers the U.S. investment grade fixed rate bond market, with index components for government and corporate securities, mortgage pass-through securities, and asset-backed securities. The NCREIF Open End Diversified Core Equity Fund Index is an equal-weighted index of the investment returns from a collection of open-end commingled funds which focus on core real estate investment strategy. The HFN Aggregate Hedge Fund Index is an equal weighted average of all single-manager hedge funds and CTA/managed futures products. The Preqin Private Capital Quarterly Index is an average of private capital portfolios, based on the actual amount of money invested in private capital. The Cliffwater Direct Lending Index is comprised of over 10,000 directly originated middle market loans, providing a benchmark for private debt. For illustrative purposes only and not indicative of any actual investment. Investors cannot invest directly in an index. Indices do not charge management fees or brokerage expenses, and no such fees or expenses were deducted from the performance shown. Volatility is represented by Standard Deviation which is a measure of price variability (risk). Past performance is not a guarantee of future results. The information presented is not intended to constitute an investment recommendation for, or advice to, any specific person. By providing this information, Intelligence Driven Advisers is not undertaking to give advice in any fiduciary capacity within the meaning of ERISA, the Internal Revenue Code or any other regulatory framework. Financial professionals are responsible for evaluating investment risks independently and for exercising independent judgment in determining whether investments are appropriate for their clients.
The Efficiency of Adding Alternatives
When paired with traditional asset classes, alternative investments may add value to an overall portfolio that leads to more efficient outcomes. Consider the following hypothetical examples that show the risk/return effects of adding alternative strategies to traditional asset allocation models over the 15-year period ending 12/31/24:
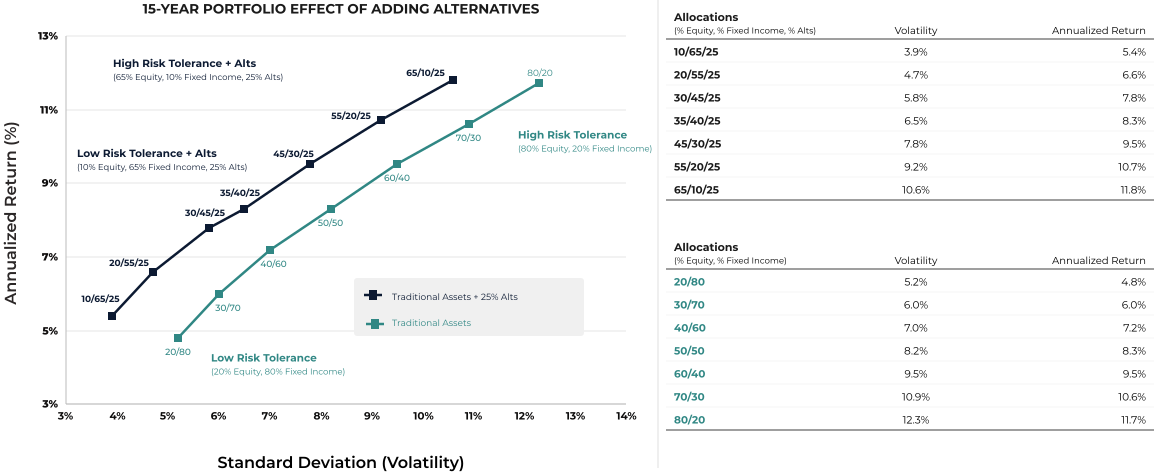
Source: Morningstar Direct, as of 12/31/2024, most recent data available. Traditional Assets composed of Equity (S&P 500 Index) and Fixed Income (Bloomberg U.S. Aggregate Bond Index). 25% Alts (Alternatives) is composed of an equally weighted portfolio across the HFN Aggregate Hedge Fund Index, NCREIF Open-End Diversified Core Equity Fund Index (NFI-ODCE), Preqin Private Capital Quarterly Index and Cliffwater Direct Lending Index. This mix was used to capture alternative investments broadly across the major alternative asset classes: Hedge Funds, Private Real Estate, Private Equity and Private Credit. Indices do not charge management fees or brokerage expenses, and no such fees or expenses were deducted from the performance shown. The S&P 500 Index is an unmanaged index of 500 companies used to measure large-cap U.S. stock market performance. The Bloomberg U.S. Aggregate Bond Index represents securities that are SEC-registered, taxable, and dollar denominated. The index covers the U.S. investment grade fixed rate bond market, with index components for government and corporate securities, mortgage pass-through securities, and asset-backed securities. The HFN Aggregate Hedge Fund Index is an equal weighted average of all single-manager hedge funds and CTA/managed futures products. The Preqin Private Capital Quarterly Index is an average of private capital portfolios, based on the actual amount of money invested in private capital. The NCREIF Open End Diversified Core Equity Fund Index is an equal-weighted index of the investment returns from a collection of open-end commingled funds which focus on core real estate investment strategy. The Cliffwater Direct Lending Index is comprised of over 10,000 directly originated middle market loans, providing a benchmark for private debt. Standard Deviation is a measure of price variability (risk). Note: Graph illustrates a 15-year investing period based on quarterly returns from 3/31/2010-12/31/2024. The returns of each sample portfolio identified above represent the weighted average on the different asset mixes. The sample portfolios are for illustrative purposes only and do not represent actual portfolios for investors. Therefore, no investors experienced these returns. In addition, the returns do not account for the reduction of any fees, which would reduce the noted returns.
Past performance is not a guarantee of future results. There can be no assurance that any index or fund will achieve comparable results or avoid substantial losses. Investors cannot invest directly in an index. The information presented is not intended to constitute an investment recommendation for, or advice to, any specific person. By providing this information, Intelligence Driven Advisers is not undertaking to give advice in any fiduciary capacity within the meaning of ERISA, the Internal Revenue Code or any other regulatory framework. Financial professionals are responsible forevaluating investment risks independently and for exercising independent judgment in determining whether investments are appropriate for their clients.
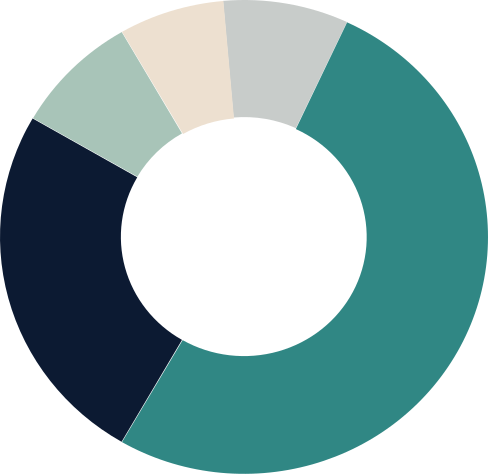
Private Market Exposure
-
Private Equity 10 -50%
Primary, Secondary, Buy -Out, Co -Investments
-
Private Credit 10 -40%
Direct Lending, Asset Backed Finance, Specialty Finance, Opportunistic
-
Private Infrastructure 10 -20%
Data & Communication, Energy, AI, Transportation
-
Private Real Estate 5 -30%
Multi -Family, Single -Family, Industrial, Retail, Data Centers, Medical
-
Liquidity Sleeve 5 -20%
Liquid Securities, Public Equities, Public Bonds, Treasuries, Money Markets